
Connection 1 of 4
Why compare regions instead of individual pixels?
A pattern may involve one area being brighter than another. Summing a region lets many pixels contribute to that comparison. With equal-sized groups, a uniformly bright crop gives similar totals on both sides.
The rectangle positions define which pattern this feature can respond to.
Connection 2 of 4
Subtract one total from the other
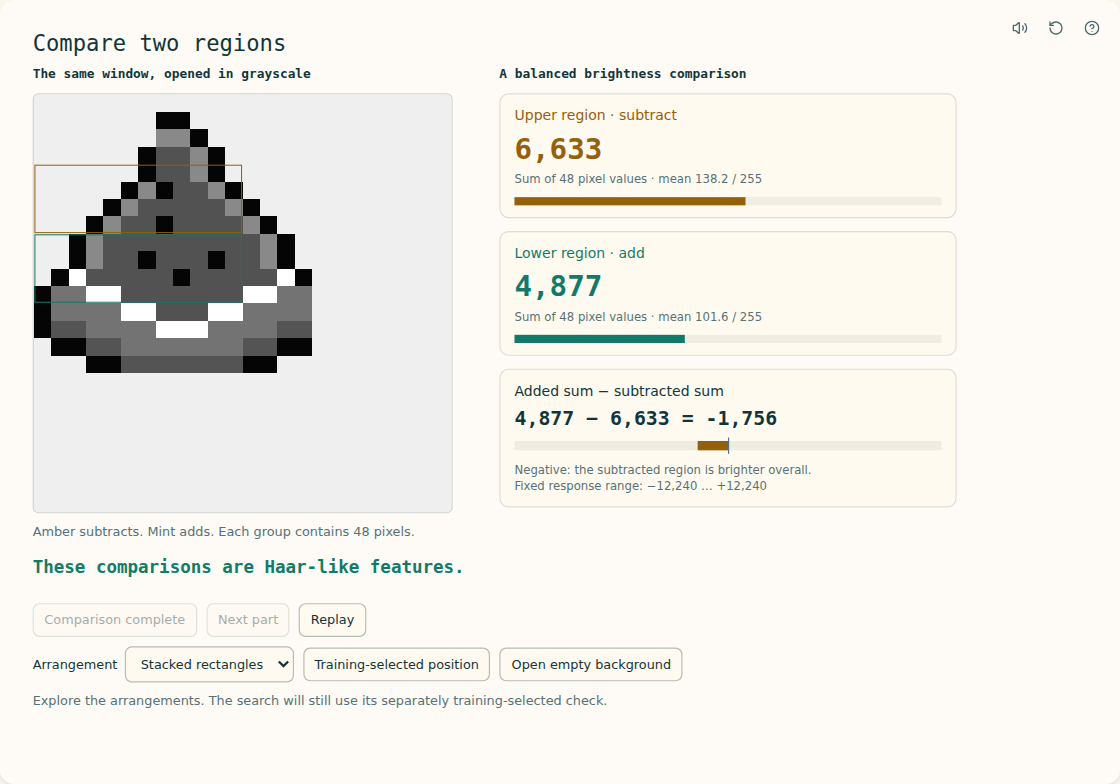
The lesson adds brightness values in the two outlined region groups.
Suppose the positive group sums to 1,800 and the negative group to 1,200. Their difference is +600. Swapping which group is brighter would change the sign.
The lesson uses the magnitude of that difference, so either contrast direction can contribute to this particular score.
signed response = 1,800 − 1,200 = 600Read it as: The minus sign compares the regions; the absolute-value bars then ignore the direction of the contrast.
Connection 3 of 4
Where did 12,240 come from?
For these feature geometries, each sign covers 48 pixels. At byte intensity 255, one group can total 48 × 255 = 12,240 while the other totals zero. That is the maximum possible magnitude for this comparison.
Dividing by this fixed maximum puts the contrast on a convenient scale.
score = |600| / 12,240 ≈ 0.04902Read it as: The denominator is a scale for this feature geometry, not another pixel measurement.
Connection 4 of 4
A cutoff turns the measurement into a cheap decision
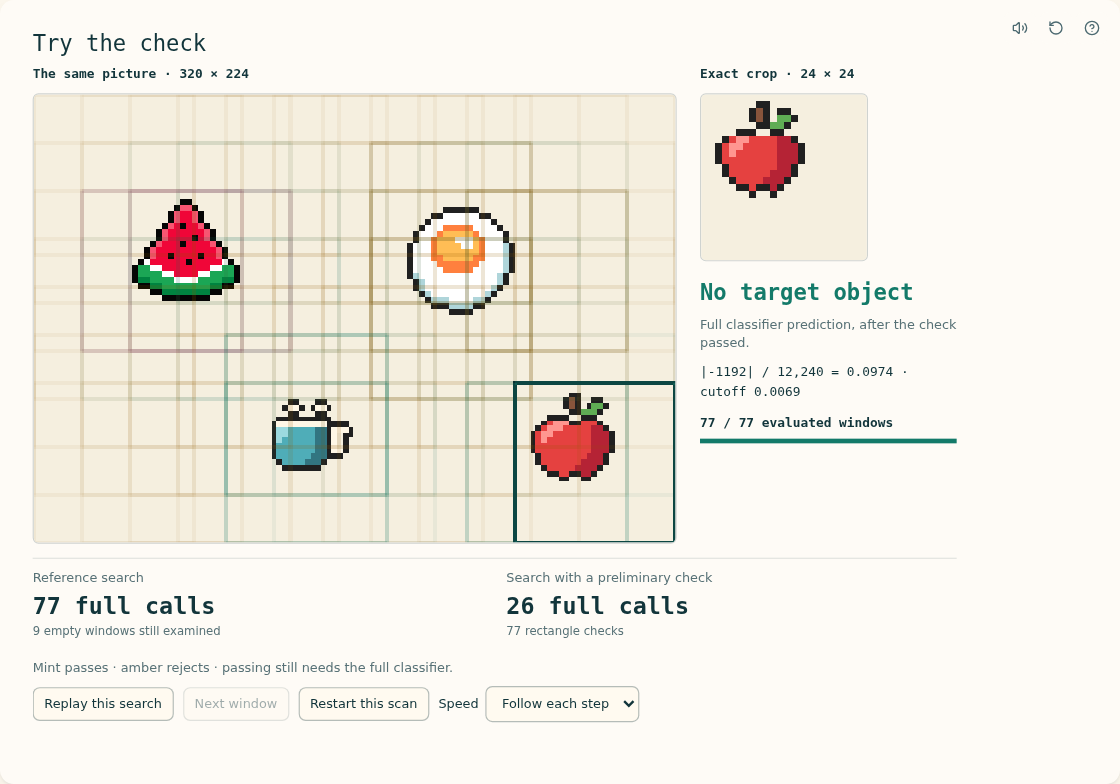
A brightness comparison acts as a preliminary check before full classification.
The score measures contrast; a cutoff decides whether this crop passes the check. Raising the cutoff demands stronger contrast and rejects more crops. It can also reject a useful target.
Passing only means “worth examining further.” It does not prove that the feature has recognized an object.
Connect it back to the picture
A Haar-like feature is a specified brightness comparison. Feature geometry, contrast magnitude and the decision cutoff have separate roles.
Full notation and technical reference
The expressions below collect the operations discussed above. You can return here when you want the compact notation.
difference = sum(positive rectangles) − sum(negative rectangles)
score = |difference| / MAX
pass = score ≥ threshold- The implementation normalizes the absolute contrast using its fixed MAX = 12,240 constant.
- The feature geometry and cutoff determine which brightness pattern passes this particular check.
Numerical reference
If the positive region sums to 1,800 and the negative region to 1,200, the signed difference is 600. The displayed check uses its magnitude divided by the module's normalization constant.
Where this explanation stops
This is a simple contrast check, not a complete face detector. The lesson's fitted checks should not be confused with a complete production Viola–Jones training pipeline.